Lesson 5: Analog Inputs & Sensors

Reading Analog Values and Working with Sensors

🎯 Learning Focus: ADC, analog sensors, and data processing

📚 Learning Objectives

By the end of this Lesson, you will:

  • Understand analog vs digital signals
  • Use analogRead() to read sensor values
  • Work with potentiometers and light sensors
  • Map and scale analog values

Key Concepts:

  • Analog-to-Digital Conversion (ADC)
  • 10-bit resolution (0-1023)
  • Voltage dividers and sensors
  • Data filtering and smoothing

📊 Section 1: Understanding Analog Signals

Analog vs Digital

While digital signals have only two states (HIGH/LOW), analog signals can have any value within a range. Arduino can read analog voltages from 0V to 5V using its Analog-to-Digital Converter (ADC).

Arduino ADC Specifications:

  • Resolution: 10-bit (1024 possible values: 0-1023)
  • Voltage Range: 0V to 5V (or 3.3V on some boards)
  • Analog Pins: A0, A1, A2, A3, A4, A5 on Arduino Uno
  • Conversion Time: ~100 microseconds

Basic Analog Reading

The analogRead() function returns a value between 0 and 1023, representing the voltage on the analog pin.

// Basic Analog Reading
const int analogPin = A0;

void setup() {
  Serial.begin(9600);
  Serial.println("Analog Reading Program Started");
}

void loop() {
  int sensorValue = analogRead(analogPin);
  
  // Convert to voltage (0-5V)
  float voltage = sensorValue * (5.0 / 1023.0);
  
  Serial.print("Raw Value: ");
  Serial.print(sensorValue);
  Serial.print(" | Voltage: ");
  Serial.print(voltage);
  Serial.println("V");
  
  delay(500);
}

🎛️ Section 2: Working with Potentiometers

Potentiometer Basics

A potentiometer is a variable resistor that creates a voltage divider. As you turn the knob, the output voltage changes proportionally.

Potentiometer Specifications & Connections:

Recommended Value: 1kΩ (1000Ω) potentiometer

Alternative Values: 10kΩ or 100kΩ will also work (different sensitivity)

  • Pin 1: Connect to 5V
  • Pin 2 (Wiper): Connect to analog input (A0)
  • Pin 3: Connect to Ground
// Potentiometer Control LED Brightness
const int potPin = A0;
const int ledPin = 9;  // PWM pin for analogWrite

void setup() {
  pinMode(ledPin, OUTPUT);
  Serial.begin(9600);
  Serial.println("Potentiometer LED Control Started");
}

void loop() {
  int potValue = analogRead(potPin);
  
  // Map potentiometer value (0-1023) to LED brightness (0-255)
  int brightness = map(potValue, 0, 1023, 0, 255);
  
  analogWrite(ledPin, brightness);
  
  Serial.print("Pot Value: ");
  Serial.print(potValue);
  Serial.print(" | LED Brightness: ");
  Serial.println(brightness);
  
  delay(100);
}

The map() Function

The map() function is essential for scaling values from one range to another. It's perfect for converting sensor readings to useful output values.

map() Syntax:

map(value, fromLow, fromHigh, toLow, toHigh)

Maps a value from one range to another proportionally

// Multiple Mapping Examples
const int potPin = A0;

void setup() {
  Serial.begin(9600);
  Serial.println("Mapping Examples");
}

void loop() {
  int potValue = analogRead(potPin);
  
  // Map to different ranges
  int percentage = map(potValue, 0, 1023, 0, 100);
  int servoAngle = map(potValue, 0, 1023, 0, 180);
  int frequency = map(potValue, 0, 1023, 100, 2000);
  
  Serial.print("Raw: ");
  Serial.print(potValue);
  Serial.print(" | Percentage: ");
  Serial.print(percentage);
  Serial.print("% | Servo: ");
  Serial.print(servoAngle);
  Serial.print("° | Freq: ");
  Serial.print(frequency);
  Serial.println("Hz");
  
  delay(200);
}

🔌 LED Wiring Diagram

Proper LED Connection with Current-Limiting Resistor

When connecting an LED to an Arduino PWM pin, you must always include a current-limiting resistor to protect both the LED and the Arduino pin from damage.

⚠️ Why Resistors Are Essential:

  • Current Protection: Arduino pins can only safely source ~20mA
  • LED Protection: LEDs have very low internal resistance
  • Without resistor: Excessive current can damage components
  • Recommended value: 220Ω resistor for most 5mm LEDs
LED wiring diagram showing proper connection with current-limiting resistor

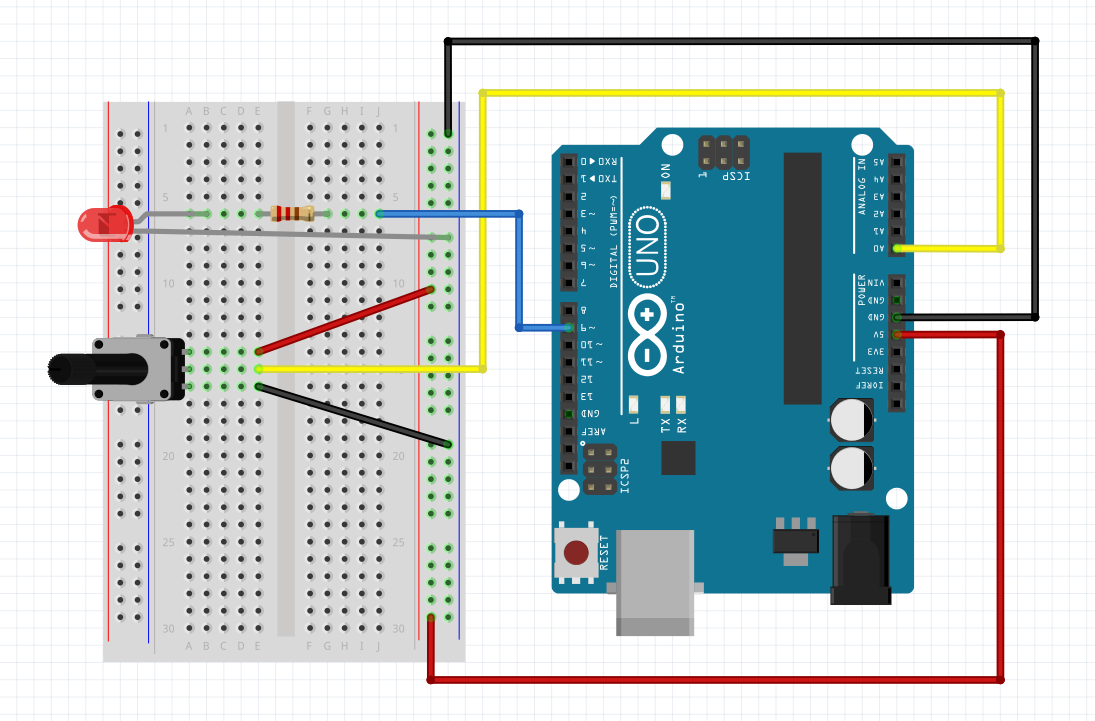
Proper LED wiring: Arduino PWM pin → Resistor → LED → Ground

🧮 Resistor Value Calculation:

Formula: R = (Supply Voltage - LED Forward Voltage) / Desired Current

For Red LED: R = (5V - 2V) / 0.015A = 200Ω

Safe Choice: 220Ω resistor (standard value, good brightness)

  • 220Ω: Most common choice, good brightness
  • 330Ω: Dimmer but very safe for all LED types
  • 470Ω: Very conservative, works with any LED

✅ Wiring Checklist:

  • • ✓ Resistor connected in series with LED
  • • ✓ LED polarity correct (long leg = positive/anode)
  • • ✓ Ground connection completed
  • • ✓ Clean breadboard connections
  • • ✓ Appropriate wire colors used

🔧 Section 3: Data Filtering and Smoothing

Why Filter Sensor Data?

Raw sensor readings often contain noise and fluctuations. Filtering helps create stable, reliable readings for better control and decision-making.

📊 Visualizing Filter Effects with Serial Plotter

Important: Use Arduino IDE's Serial Plotter (Tools → Serial Plotter) instead of Serial Monitor to see the filtering effects visually. The plotter shows both raw and filtered data as real-time graphs, making it easy to see how filtering smooths out noise and fluctuations.

⚠️ Arduino IDE 2.x Serial Plotter Format:

Newer Arduino IDE versions require tab-separated or comma-separated values without text labels for proper plotting. Use format: rawValue\tfiltered or rawValue,filtered

  • Raw data: Shows as a jagged, noisy line
  • Filtered data: Shows as a smooth, stable line
  • Real-time comparison: See both lines updating simultaneously
Arduino Serial Plotter showing raw sensor data (jagged blue line) vs filtered data (smooth red line) demonstrating the smoothing effect of data filtering

Serial Plotter Example: Notice how the raw sensor data (jagged line) becomes smooth and stable after filtering (smooth line)

Common Filtering Techniques:

  • Moving Average: Average of last N readings
  • Exponential Smoothing: Weighted average favoring recent values
  • Threshold Filtering: Ignore small changes
// Moving Average Filter
const int sensorPin = A0;
const int numReadings = 10;

int readings[numReadings];
int readIndex = 0;
int total = 0;
int average = 0;

void setup() {
  Serial.begin(9600);
  
  // Initialize all readings to 0
  for (int i = 0; i < numReadings; i++) {
    readings[i] = 0;
  }
  
  Serial.println("Moving Average Filter Started");
}

void loop() {
  // Subtract the last reading
  total = total - readings[readIndex];
  
  // Read new value
  readings[readIndex] = analogRead(sensorPin);
  
  // Add new reading to total
  total = total + readings[readIndex];
  
  // Advance to next position
  readIndex = readIndex + 1;
  if (readIndex >= numReadings) {
    readIndex = 0;
  }
  
  // Calculate average
  average = total / numReadings;
  
  // For Serial Monitor (with labels)
  Serial.print("Raw: ");
  Serial.print(readings[readIndex == 0 ? numReadings-1 : readIndex-1]);
  Serial.print(" | Filtered: ");
  Serial.println(average);
  
  // For Serial Plotter (Arduino IDE 2.x format - uncomment these lines)
  // Serial.print(readings[readIndex == 0 ? numReadings-1 : readIndex-1]);
  // Serial.print("	");  // Tab separator
  // Serial.println(average);
  
  delay(100);
}

Simple Exponential Smoothing

A simpler alternative that gives more weight to recent readings while still smoothing out noise.

// Exponential Smoothing Filter
const int sensorPin = A0;
float smoothedValue = 0;
const float alpha = 0.1;  // Smoothing factor (0-1)

void setup() {
  Serial.begin(9600);
  smoothedValue = analogRead(sensorPin);  // Initialize
  Serial.println("Exponential Smoothing Started");
}

void loop() {
  int rawValue = analogRead(sensorPin);
  
  // Apply exponential smoothing
  smoothedValue = (alpha * rawValue) + ((1 - alpha) * smoothedValue);
  
  // For Serial Monitor (with labels)
  Serial.print("Raw: ");
  Serial.print(rawValue);
  Serial.print(" | Smoothed: ");
  Serial.println(smoothedValue);
  
  // For Serial Plotter (Arduino IDE 2.x format - uncomment these lines)
  // Serial.print(rawValue);
  // Serial.print("	");  // Tab separator
  // Serial.println(smoothedValue);
  
  delay(100);
}

🛠️ Hands-On Activity: Environmental Monitor

Project: Multi-Sensor Environmental Monitor

Build a system that monitors light levels and temperature, with automatic responses and data logging.

Required Components:

  • • Arduino Uno
  • • Photoresistor (LDR) - Optional for challenge project
  • • TMP36 temperature sensor (or potentiometer for simulation)
  • • 2 LEDs (different colors)
  • • 10kΩ resistor, 2 × 220Ω resistors
  • • Breadboard and jumper wires

🔧 Optional Challenge Tasks (Requires LDR):

  1. Read both light and temperature sensors
  2. Implement moving average filtering
  3. Control LEDs based on sensor thresholds
  4. Display formatted data to Serial Monitor
  5. Add data logging with timestamps
// Environmental Monitor Solution
const int ldrPin = A0;
const int tempPin = A1;
const int lightLED = 12;
const int tempLED = 13;

// Filtering variables
const int numReadings = 5;
int lightReadings[numReadings];
int tempReadings[numReadings];
int readIndex = 0;
int lightTotal = 0;
int tempTotal = 0;

// Thresholds
const int lightThreshold = 300;
const float tempThreshold = 25.0;  // Celsius

void setup() {
  pinMode(lightLED, OUTPUT);
  pinMode(tempLED, OUTPUT);
  Serial.begin(9600);
  
  // Initialize arrays
  for (int i = 0; i < numReadings; i++) {
    lightReadings[i] = 0;
    tempReadings[i] = 0;
  }
  
  Serial.println("Environmental Monitor Started");
  Serial.println("Time,Light,Temp(C),Light_LED,Temp_LED");
}

void loop() {
  // Read sensors
  int rawLight = analogRead(ldrPin);
  int rawTemp = analogRead(tempPin);
  
  // Update moving averages
  lightTotal = lightTotal - lightReadings[readIndex];
  tempTotal = tempTotal - tempReadings[readIndex];
  
  lightReadings[readIndex] = rawLight;
  tempReadings[readIndex] = rawTemp;
  
  lightTotal = lightTotal + lightReadings[readIndex];
  tempTotal = tempTotal + tempReadings[readIndex];
  
  readIndex = (readIndex + 1) % numReadings;
  
  // Calculate averages
  int avgLight = lightTotal / numReadings;
  int avgTemp = tempTotal / numReadings;
  
  // Convert temperature to Celsius
  float voltage = avgTemp * (5.0 / 1023.0);
  float temperatureC = (voltage - 0.5) * 100.0;
  
  // Control LEDs based on thresholds
  bool lightLEDState = avgLight < lightThreshold;
  bool tempLEDState = temperatureC > tempThreshold;
  
  digitalWrite(lightLED, lightLEDState);
  digitalWrite(tempLED, tempLEDState);
  
  // Data logging format
  Serial.print(millis());
  Serial.print(",");
  Serial.print(avgLight);
  Serial.print(",");
  Serial.print(temperatureC);
  Serial.print(",");
  Serial.print(lightLEDState ? "ON" : "OFF");
  Serial.print(",");
  Serial.println(tempLEDState ? "ON" : "OFF");
  
  delay(1000);
}

📝 Assessment & Homework

📊 Lesson 5 Quiz Topics:

  • Analog vs digital signals
  • ADC resolution and range
  • analogRead() function
  • map() function usage
  • Sensor interfacing and filtering

🏠 Homework Assignments:

  • 1. Complete the environmental monitor project
  • 2. Create a voltage meter using analog input
  • 3. Experiment with different filtering techniques
  • 4. Research other analog sensors (flex, force, etc.)
  • 5. Design a simple data logger system

💡 Pro Tips for Success:

← Lesson 4: Digital I/O Basics
Take Quiz 📝
Lesson 6: PWM & Analog Outputs →