Student Information
Please enter your email address so your instructor can see your experiment results:
Experiment 1.2: Practice Collecting and Analyzing Data with Pendulums
Purpose
To explore collecting and analyzing data using tables and graphs while investigating pendulums.
Materials Needed:
- String
- Masking tape
- Stopwatch or use the built-in 30-second timer below
- Pencil
- Paper clip
- 5 Washers
- Half a piece of cardstock paper (cut paper in half lengthwise) or cardboard 8.5" × 5.5"
- Protractor
- Metric ruler
Question:
How does changing the mass of a pendulum affect the number of swings in one minute? How does changing the length of a pendulum affect the number of swings in one minute?
Hypothesis:
Write your prediction of how the number of swings of a pendulum will change as mass is changed. Write your prediction of how the number of swings of a pendulum will change as length is changed.
Procedure - Part 1: Mass
Step 1: Variables
Write what the independent and dependent variables are in the data section of your lab notebook.
Step 2: Setup Pendulum
You must keep all the variables constant except the one you're testing. So to keep the height from which you release the pendulum the same each time, follow these instructions. With the protractor draw a dotted line down the center of your paper or cardboard. Then position the protractor so the center line of the protractor (90°) is on the dotted line as shown in Figure 1.30. Draw a solid line about 20 degrees from the dotted line as shown. Set aside the protractor.
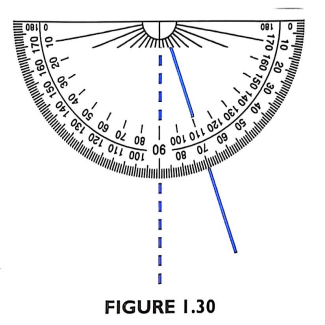
Figure 1.30: Protractor setup for consistent pendulum release angle
Step 3: Attach Card
Tape the card to the edge of a table so that it hangs down and you can see the lines you just drew.
Step 4: Measure String
With the ruler, measure out 32 cm of string. Tie one end of the string to the end of the pencil.
Step 5: Position Pencil
Tape the pencil to the top of the table so that it lines up with the dotted line on your paper and hangs out over the edge enough that the pendulum can easily swing.
Step 6: Create Pendulum
Next, take the paper clip and bend it so it has a loop at the top and a hook shape at the bottom. It should look like a Christmas ornament hanger (see Figure 1.31 for an example).
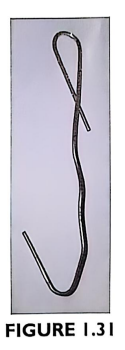
Figure 1.31: Bent paperclip as pendulum weight holder
Step 7: Attach String
Tie the other end of the string hanging from the pencil to the loop on your paperclip. You now have a pendulum. Check to make sure that the string of your pendulum lines up with the dotted line on your card. If it doesn't, adjust the pencil or the card to make it line up. The string shouldn't touch the card so that it can freely swing, but you should be able to see that the string lines up with your dotted line when looking at it from directly in front of it.
Mass Testing (Steps 8-14)
Now you will test the effect of mass on the number of swings. Add one washer to the paperclip. Put the paperclip back from the rest position (B in Figure 1.32) so that the string lines up with the solid line you drew on the card (position A in Figure 1.32). When your helper says "go," release the paperclip and count how many times the washer-pendulum swings back and forth for 30 seconds. One swing is counted from the release position (A) to the other side (C) and back to the release position (A). Multiply the number you counted by 2. This gives you the number of swings per minute and is known as the frequency. Now find the period by dividing the frequency into 1 (period = 1/frequency). Record the period in your data table.
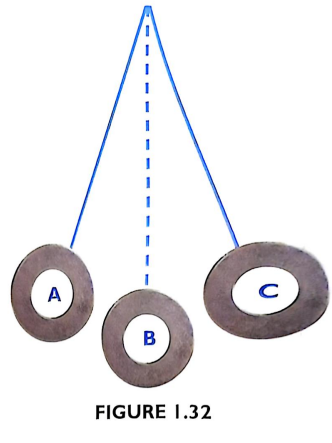
Figure 1.32: Pendulum swing positions - Release from A, through rest position B, to C, and back
30-Second Timer for Mass Testing
Data Collection - Mass Effect
| Number of Washers | Trial 1 (swings/30s) | Trial 2 (swings/30s) | Trial 3 (swings/30s) | Average |
|---|---|---|---|---|
| 1 washer | 0 | |||
| 2 washers | 0 | |||
| 3 washers | 0 | |||
| 4 washers | 0 | |||
| 5 washers | 0 |
Procedure - Part 2: Length
Step 15: Variables for Length Test
Write what the independent and dependent variables are in the data section of your lab notebook.
Step 16: Reset Mass
Remove 3 washers from the paperclip. You should have 2 washers on the paperclip for the rest of this experiment.
30-Second Timer for Length Testing
Data Collection - Length Effect
| String Length (cm) | Trial 1 (swings/30s) | Trial 2 (swings/30s) | Trial 3 (swings/30s) | Average |
|---|---|---|---|---|
| 30 cm | 0 | |||
| 25 cm | 0 | |||
| 20 cm | 0 | |||
| 15 cm | 0 | |||
| 10 cm | 0 |
Data Visualization:
Your graphs will automatically update as you enter data and calculate averages.
Part 1: Mass vs. Average Period
Part 2: Length vs. Average Period
Results:
- Find the average period for each mass in Part 1 of the experiment by adding the period you found in each trial and dividing by 3.
- Analyze the graphs above. Notice how your independent variable (mass or length) affects the dependent variable (average period). The graphs automatically scale to show all your data clearly.
- Look for patterns and trends in both graphs. Do you see any relationships between the variables?
Conclusion:
How has organizing your data in tables and graphs helped you to analyze the data? What patterns or trends do you see? Does this correspond to what you read in the text? Write a short paragraph responding to these questions.